CURRENT DENSITY DISTRIBUTION IN ELECTROCHEMICAL CELLS
Konstantin I. Popov1, Miomir G. Pavlovic2,3, and Predrag M. Zivkovic1 1University of Belgrade, Faculty of Technology and Metallurgy
Karnegijeva 4, 11000 Belgrade, Serbia 2University of Eastern Sarajevo, Faculty of Technology Zvornik
Karakaj bb, 75400 Zvornik, Bosnia and Herzegovina 3University of Belgrade, ICTM-Department of Electrochemistry
Njegoševa 12, 11000 Belgrade, Serbia
(February, 2011)
It is a known fact that different morphologies of electrodeposited metal can appear at the different positions of the electrode surface. This means that the local current density during electrodeposition of a metal varies from point to point on an electrode surface. This is due to the following factors:
Although all factors effect the current distribution simultaneously, there are three main types of current distribution on a macroprofile.
If the influence of overpotential is negligible, primary distribution is determined by the geometry of the system and the conductivity of the solution. In case of the secondary distribution the activation overpotential and in case of tertiary distribution both the activation and diffusion overpotentials also have to be taken into consideration.
Even for a simple electrode configuration, the calculation of the current distribution is a complex problem and the difficulties further increase with increasing complexity of the geometry, especially if the limiting diffusion current varies over the electrode due to the different geometric and hydrodynamic conditions. Because of this, analytical solutions can be found only for some cases (Wagner, Newman), while in other cases numerical solutions are available. If the complete calculation cannot be performed, it is possible to estimate certain trends, using a dimensionless group called the Wagner number (see the Appendix).
The current distribution on a macroprofile is very important in many electrochemical technologies and devices. In electroplating, the current distribution determines the local variations in the thickness of the coating. In electrowinning and electrorefining of metals, a non-homogenous current distribution can cause a short circuit with the counter electrode. In electroforming corner weakness and failure can occur due to nonuniform deposition. This is very important in all three-dimensional electrodes, as well as in some storage batteries. In all the cited cases a uniform current density distribution over the macroprofile is required for successful and efficient operation.
In a metallic conductor, the free conduction electrons transport the charge, whereas in an electrolytic conductor it is the ions that move and carry the charge. In order to include an electrolytic conductor in an electrochemical circuit it is necessary to make electrical contacts to and from the electrolyte by metallic conductors. A metallic conductor immersed in an electrolyte solution is an electrode, and two electrodes connected electrolytically represent an electrochemical cell.
The simplest electrochemical circuit is shown in Figure 1.
Obviously, a steady current flow in this circuit can only be maintained if there is a change of charge carrier at the metal-electrolyte interface by a chemical transformation involving the transfer of electrons across the interface, that is, by an electrochemical reaction. It constitutes the bridge between the current of electrons in the metallic part of the electrochemical circuit and the current of ions in the electrolytic part of the circuit.
The conducting electrons move throughout the whole volume of metallic conductor, but in the electrolytic one only a part of volume is active, depending on the shape of electrodes.
The effect of interelectrode distance
Fig. 2. Current distribution in parallel plate electrode geometry. “A”-electrode width, “L”-the distance between the edge of the electrode and the side walls, “l”-is the distance between the electrodes.
The cell with two equal parallel-plane electrodes represents the elementary cell of electrode arrangement in electrochemical refining and winning processes.
It is a well-known fact that in a cell with parallel electrodes (if the electrode edges do not touch the side walls of the cell), the current density is higher at the edges than at the center of the electrode. This is because the current flow passes partially around the rectangular space between the electrodes. The increased current density at the edges of the electrodes can be easily noticed by observing the quality of the metal electrodeposit at the cathode. In some cases the deposit in the central part of the cathode may be compact and flat whereas the occurrence of dendrites is observed at the edges. The appearance of dendrites at the edges of the cathodes in such situations is the most important problem of the current density distribution, because the growing dendrites could cause short circuits followed by a decrease in the current efficiency, or even damage the power supply.
The current density distribution in a rectangular electrolytic cell in which parallel electrodes cover only part of the wall is illustrated in Figure 2
The degree of current line penetration into the solution between the edges of the electrodes and the side walls of the cell is an indicator of the ability of an electrolyte to distribute the current density uniformly over the entire electrode.
Fig. 3. A cell with parallel electrodes.
Fig. 4. Current density-cell voltage dependencies of the system
(-)Cu | 0.1 mol/dm3 copper sulfate, 0.1 mol/dm3 sulfuric acid | Cu(+) with an interelectrode
distance of 20 mm for different distances between the edge of the
electrode and the side wall of the cell indicated in the diagram.
Fig. 5. Current density-cell voltage dependencies of the system (-)Cu | 0.1 mol/dm3 copper sulfate, 0.1mol/dm3 sulfuric acid | Cu(+) with an interelectrode distance of 150 mm for different distances between the edge of the electrode and the side wall of the cell indicated in the diagram.
The following experiments were carried out in the cell presented in Figure 3.
The dependences of the current density on the cell voltage for different interelectrode distances and different distances between the edge of the electrode and side wall, for copper deposition at a temperature of 20oC (68oF) are shown in Figures 4 and 5. The dimensions of electrodes were 5.0 × 5.0 cm2.
As expected, the increase of interelectrode distance, that is, the ohmic resistance of the cell, leads to the increase of current line penetration between the edges of electrodes and the side walls of the cell, and hence, to worse current density distribution.
The edge and the tip effects
It can be seen from Figure 2 that there is only one current line between two symmetrically positioned points on the anode and cathode in the homogeneous field. Between such points on the edges of electrodes there are a number of current lines. Assuming that each current line is characterized by the same ohmic resistance it can be concluded that they are connected in parallel, making overall edge resistance lower, and hence, the potential at the edges and the edge current density larger than in the homogeneous field. This is because the cell voltage is the sum of cathodic and anodic overpotentials and corresponding ohmic voltage drop in the electrolytic cell (see the Appendix). Hence, the lower the ohmic resistance between two points on the electrodes, the larger the current density between them, and the nonuniform current density distribution is due to the different ohmic voltage drops between different pairs of points on the electrodes. This leads to different morphology at the edge relative to the morphology in the middle of the cathode for a variety of electrochemical technologies (see the related articles).
Normally, the edge effect is not related to the plane parallel electrode arrangement only, but to each edge in any position. In fact, the edge position corresponds to the near electrode in Figure 15 (see the Appendix).
Fig. 6. Current distribution in cylindrical electrode geometry: a) front cross section, b) top cross section.
It can be seen from Figure 6 that the dissipation of current lines from the tip of a stationary wire electrode is more pronounced than in the case of the edges of plane parallel electrodes. This is because the dissipation in the former case occurs through the space, while in the latter case it takes place in one plane, normal to the electrodes, to which two symmetrically positioned points belong. Hence, it can be taken that the overall resistance between the tip of the cathode and anode will be equal to an infinitely large number of resistances, as in the case of the edges of two plane parallel electrodes connected in parallel, being equal to zero.
In this way the ohmic potential drop in a homogenous field transforms into the electrochemical overpotential for points at the tip of a wire electrode or in a similar position. This means a larger tip current density than in a homogenous field. Finally, if the anode surface area is much larger than that of the cathode, the anodic overpotential can be neglected and the cell voltage becomes overpotential at the tip of electrode.
In order to illustrate the tip effect and the effect of the ohmic resistance of a cell, deposition of copper was performed at room temperature on to a stationary copper wire cathode (length 40 mm and diameter 0.8 mm) placed in the middle of a cylindrical cell surrounded by a high purity copper plate anode (length 5 cm and diameter 6 cm). The plot of cell voltage and overpotential against current density for the copper deposition are shown in Figures 7 and 8.
Fig. 7. Plots of overpotential (1) and cell voltage (2) against current density for the copper deposition from 0.1 mol/dm3 copper sulfate.
Fig. 8. Plots of overpotential (1) and cell voltage (2) against current density for copper deposition from 0.1 mol/dm3 copper sulfat in 0.5 mol/dm3 sulfuric acid.
It could be seen that the tip overpotential (cell potential) is larger than the overpotential in the middle of the electrode during deposition from pure copper sulfate solution, while during deposition from acidic solution the cell potential and the overpotential are practically the same. In the former case there is a large difference in the morphology of the deposit at the tip and the rest of the electrode (Figure 9a), while in the latter case the quality of the deposit is the same over the whole surface (Figure 9b).
Fig. 9a. Copper deposit obtained on a stationary copper wire electrode from 0.1 mol/dm3 copper sulfate. Quantity of electricity used: 40 mAh/cm2. Overpotential: 250 mV.
Fig. 9b. Copper deposit obtained on a stationary copper wire electrode from 0.1 mol/dm3 copper sulfate in 0.5 mol/dm3 sulfuric acid. Quantity of electricity used: 40 mAh/cm2. Overpotential: 250 mV.
Fig. 10. Plots of overpotential (1) against current density and cell voltage (2) for cadmium electrodeposition from sulphate solution with additive.
In order to illustrate the edge effect and the effect of an increased cathodic Tafel slope, cadmium was deposited onto a stationary vertical flat copper electrode of area 1 cm × 1 cm placed in the middle of a cylindrical cell of diameter 6 cm, and height 5 cm. The cell surface was covered by the anode, which was made from high purity cadmium plate. The reference electrode was a high purity cadmium wire. The electrolyte used in all the experiments was a solution of 0.25 mol/dm3 cadmium sulfate in 0.5 mol/dm3 sulfuric acid to which 3.3 g/dm3 polyoxyethylene alkylphenol (9.5 mol ethylene oxide) was added.
At low overpotentials there is no adsorption of organic additive and the plating solution behaves as a pure solution. At large overpotentials the strong adsorption of additive takes place, significantly increasing the cathodic Tafel slope from 60 to 160 mV/decade.
Fig 11a. Cadmium deposits obtained from sulphate solution with additive, at the edge of a copper electrode. The thickness of deposit was 3 μm. Deposition overpotential: 40 mV
Fig 11b. Cadmium deposits obtained from sulphate solution with additive, at the edge of a copper electrode. The thickness of deposit was 3 μm. Deposition overpotential: 530 mV.
Figure 10 shows that there is a large difference between the deposition overpotential and the cell voltage (tip overpotential) at low overpotentials which becomes negligible at high overpotentials, indicating a uniform current density distribution, due to the additive adsorption, as illustrated in Figure 11.
Deposition current density in both cases was the same. It is necessary to note that the polarization curves in Figure 10 are in a fair agreement with those presented in Figure 18 (see the Appendix).
Corner weakness phenomena
Fig. 12. Schematic representation of microphotographs illustrating the “corner weakness” effect.
“Corner weakness” occurs in heavy deposits or electroforms at screened parts of the cathode, that is the corners. The deposit is thinner and at these areas, in extreme cases, there is no deposition at all along the line of the corner bisector (Figure 12).
The consequence is the emergence of fracture under negligible load along the line of the corner bisection, instead of fracture at much higher loads across the narrowest cross-section of an electroform normal to the line of the load.
This phenomenon can be elucidated using the following assumptions:
It is obvious that there should be no overlap of the deposit upon prolonged deposition. Moreover, it should be noted that the profiles can be calculated assuming a constant current density, which is not the case in a real system where the space in the vicinity of the corner vertex is increasingly screened as the deposit grows. This implies that the real distribution of the metal deposit in the corners is worse than that calculated (see the Appendix) and shown in Figure 13.
Fig. 13. Simulation of a growth of the deposit from the model protrusion (h = 5 cm, l = 15 cm) calculated for pure ohmic control employing Equations [8] and [9].
Fig. 14. Schematic representation of microphotographs of cross-sections of deposits illustrating the effect of surface active agents on the elimination of "corner weakness”.
The proposed model implies that there is no current component in the direction of the corner vertex, and that the appearance of a crack along the corner bisector is to be expected.
A compact deposit cannot be obtained directly, but rather by the build up of the deposit in the x and y direction. An overlap of the x and y oriented deposits should occur when the current density is virtually independent of the distance from the very corner, as happens in the case of deposition in the presence of appropriate surfactants (adsorbing on the surface), Figure 14, which makes the current density distribution uniform as demonstrated in Figure 11.
Conclusions
This article demonstrated, using some experimental results and theoretical considerations, that it cannot be assumed that the current density on the electrode surface will be uniform in practically any electrochemical situation. Under extreme conditions, this non-uniformity can have serious consequences, such as degradation or loss of products of electrochemical processes and decreased efficiency of the operation of electrochemical cells. The practical examples highlighted in this article were those relating to electroplating (or electrodeposition) of metals, but the same difficulties will exist in many other processes. Some closely related ones are the electrowinning/electrorefining of metals, and the production of metal powders by electrolysis. (Interestingly, there is one exception, the electroless deposition of metals, where this problem is completely absent.) However, the current distribution effects have to be considered in practically all electrochemical processes and devices, for example the rechargeable batteries, nonrechargeable batteries, and fuel cells.
was used, according to Kasper, Hoar, and Agar.) The Wagner number represents the ratio of the polarization resistance to the solution resistance. The larger it is, the more even is the current distribution in spite of non-uniform geometry. In general, the current distribution is the more uniform:
the smaller the characteristic length of the system,
the larger the conductivity of the solution, and
the larger the slope of the activation overpotential-current density curve.
Obviously, the Wagner number can be used only to compare the current distribution in a cell with non-uniform geometry as the electrolyte is changed.
The situation is the same if the ability of an electrolyte to uniformly distribute the current density is experimentally determined using the method of Haring and Blum.
In the case of complete ohmic control of the deposition process, it is obvious that the current density at the elevation near to the anode, jn, can be expressed as
[5]
where jf is the current density at the planar cathode surface far from the anode, l is the interelectrode distance, and h is the height of the elevation as denoted in Figure 15.
Fig. 15. Schematic representation of an electrochemical cell.
The situation is somewhat different in case of activation control-ohmic control. The voltage imposed on an electrochemical cell, Ecell, can be expressed not only as a function of jf for the part of the cathode far from the anode [6], but also as a function of jn for the cathode segment near to anode [7]:
[6]
[7]
However, an estimation of the effects of different parameters on the current density distribution can simply be made by plotting [6] and [7], that is Ecell, as a function of current density at parts of the cathode near to, jn, and far from the anode, jf respectively.
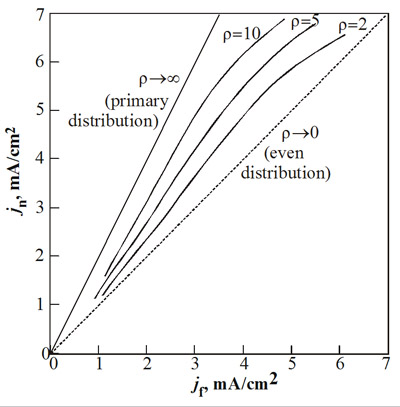
Hence, the effect of the solution resistivity can be estimated by deriving the dependency of current density at the near part of the cathode on current density at the far part of the cathode from Ecell – jn, with Ecell – jf dependencies calculated for different resistivities, while all other cell parameters are kept constant. The calculated dependencies are plotted in Figure 16. It can be seen that, besides the conductivity of the electrolyte, the kind of the control of the deposition process also determines the current distribution.
The result is shown in Figure 16, together with boundary dependences calculated using Equation [5]. As can be seen, the larger the conductivity of the electrolyte, the better is the current density distribution. Also, the distribution is better under total activation control at low cell voltages and under total diffusion control at high cell voltages than under mixed activation-diffusion-ohmic control at medium cell voltages.
Fig. 16. Dependencies of current density at the near part of the cathode ( jn ) on the current density at far part of the cathode ( jf ) for different resistivities of the solution (ρ = 2, 5, 10 Ωcm). All other cell parameters are kept constant:
h = l = 5 cm, ba=40 mV/decade, bc = 120 mV/decade j0a = j0c = 0.1 mA/cm2, jL = 7 mA/cm2.
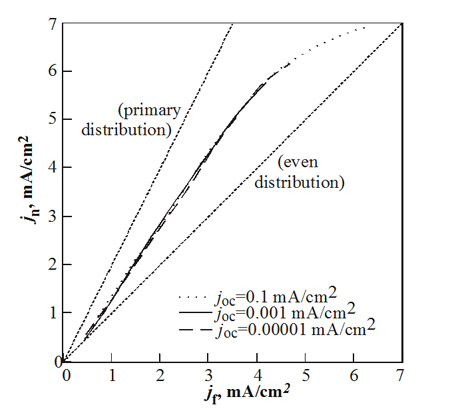
The effect of cathodic exchange current density, j0c, can be analyzed in the same manner. The Ecell – jn and Ecell – jf dependencies were calculated for different cathodic exchange current densities, keeping other parameters constant. The corresponding derived dependencies of the current density at the near part of the cathode on the current density at the far part of the cathode are given in Figure 17. It can be seen that a change in the cathodic exchange current density does not affect the current density distribution (Figure 17). The same should be expected for changes in the anodic exchange current density (see Equations [6] and [7]).
Fig. 17. Dependencies of current density at the near part of the cathode ( jn ) on the current density at the far part of the cathode ( jf ) for different cathodic exchange current densities ( j0c = 0.1, 0.001, 0.00001 mA/cm2). All other cell parameters are kept constant: h = l = 5 cm, ba = 40 mV/decade, bc = 120 mV/decade, j0a = 0.1 mA/cm2, jL = 7 mA/cm2.
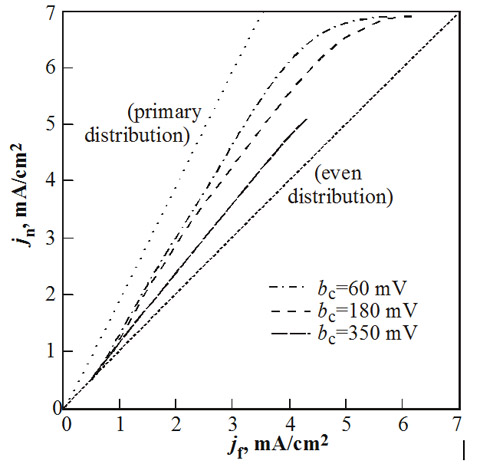
Fig. 18. Dependencies of current density at the near part of the cathode ( jn ) on the current density at the far part of the cathode ( jf ) for different cathodic Tafel slopes (bc = 60, 180, 350 mV/decade). All other cell parameters are kept constant: h = l = 5 cm, ba = 40 mV/decade, j0a = j0c = 0.1 mA/cm2, jL = 7 mA/cm2.
Finally, the effect of cathodic Tafel slope, bc, is illustrated in Figure 18. It can be concluded that increasing the cathodic Tafel slope considerably improves the current density distribution.
It must be stressed that the above consideration do not require the experimental verification because it has been clearly shown that current density-cell voltage dependencies could be successfully calculated using corresponding kinetic parameters, interelectrode distances and solution conductivity, for different distances at the electrode surface.
According to the assumed model of current line division it follows that there is no deposition along the line of bisection if the division of the current lines occurs along the line indicated by the dashed line in Figure 19. It can be seen that this configuration provides the same density of current lines at the cathode as at the anode.
Fig. 19. Evaluation of a current distribution in the cell using the concept of current line division.
Assuming total ohmic control of deposition process it can be obtained
[8]
and
[9]
which enable the calculation of the deposit profiles at the cathode represented by Figure 13.
Equations [8] and [9] may be utilized for the calculation of the current density distribution at the beginning of deposition. The results of this calculation are shown in Figure 13, as well as for different deposition times.
Acknowledgements
Fig. 1:
Konstantin I. Popov, Stojan S. Djokić, Branimir N. Grgur, „Fundamental Aspects of Electrometallurgy“, Kluwer Academic / Plenum Publishers, New York, 2002, Fig. 2.1, Chapter 2, p. 5. Reproduced with permission of Springer, Dordrecht, The Netherlands.
Fig. 2:
K. I. Popov, S. K. Zečević, S. M. Pešić, „The current distribution in an electrochemical cell. Part I. The current-voltage relationship for a cell with parallel plate electrodes”. J. Serb. Chem. Soc., 60(1995)307-16, Fig. 1, p. 308. Reproduced with permission of The Serbian Chemical Society, Belgrade, Serbia.
Konstantin I. Popov, Stojan S. Djokić, Branimir N. Grgur, „Fundamental Aspects of Electrometallurgy“, Kluwer Academic / Plenum Publishers, New York, 2002, Fig. 4.1, Chapter 4, p. 103. Reproduced with permission of Springer, Dordrecht, The Netherlands.
Fig. 3:
K. I. Popov, S. K. Zečević, S. M. Pešić, „The current distribution in an electrochemical cell. Part I. The current-voltage relationship for a cell with parallel plate electrodes”. J. Serb. Chem. Soc., 60(1995)307-16, Fig. 3, p. 310. Reproduced with permission of The Serbian Chemical Society, Belgrade, Serbia.
Konstantin I. Popov, Stojan S. Djokić, Branimir. N. Grgur, „Fundamental Aspects of Electrometallurgy“, Kluwer Academic / Plenum Publishers, New York, 2002, Fig. 4.6, Chapter 4, p. 112. Reproduced with permission of Springer, Dordrecht, The Netherlands.
Fig. 4:
K. I. Popov, S. K. Zečević, S. M. Pešić, „The current distribution in an electrochemical cell. Part I. The current-voltage relationship for a cell with parallel plate electrodes”. J. Serb. Chem. Soc., 60(1995)307-16, Fig. 4, p. 311. Reproduced with permission of The Serbian Chemical Society, Belgrade, Serbia.
Konstantin I. Popov, Stojan S. Djokić, Branimir N. Grgur, „Fundamental Aspects of Electrometallurgy“, Kluwer Academic / Plenum Publishers, New York, 2002, Fig. 4.7, Chapter 4, p. 112. Reproduced with permission of Springer, Dordrecht, The Netherlands.
Fig. 5:
K. I. Popov, S. K. Zečević, S. M. Pešić, „The current distribution in an electrochemical cell. Part I. The current-voltage relationship for a cell with parallel plate electrodes”. J. Serb. Chem. Soc., 60(1995)307-16, Fig. 7, p. 312. Reproduced with permission of The Serbian Chemical Society, Belgrade, Serbia.
Konstantin I. Popov, Stojan S. Djokić, Branimir N. Grgur, „Fundamental Aspects of Electrometallurgy“, Kluwer Academic / Plenum Publishers, New York, 2002, Fig. 4.10, Chapter 4, p. 114. Reproduced with permission of Springer, Dordrecht, The Netherlands.
Fig. 6:
K. I. Popov, M. G. Pavlović, E. R. Stojilković, Z. Ž. Stevanović, „The current density distribution on stationary wire electrodes during copper and lead electrodeposition”, Hydrometallurgy, 46(1997)321-36, Fig. 2, p. 324. Reproduced with permission of Elsevier.
Konstantin I. Popov, Stojan S. Djokić, Branimir N. Grgur, „Fundamental Aspects of Electrometallurgy“, Kluwer Academic / Plenum Publishers, New York, 2002, Fig. 4.21, Chapter 4, p. 125. Reproduced with permission of Springer, Dordrecht, The Netherlands.
Fig. 7:
K. I. Popov, M. G. Pavlović, E. R. Stojilković, Z. Ž. Stevanović, „The current density distribution on stationary wire electrodes during copper and lead electrodeposition”, Hydrometallurgy, 46(1997)321-36. Fig. 7, p. 331. Reproduced with permission of Elsevier.
Konstantin I. Popov, Stojan S. Djokić, Branimir N. Grgur, „Fundamental Aspects of Electrometallurgy“, Kluwer Academic / Plenum Publishers, New York, 2002, Fig. 4.22, Chapter 4, p. 128. Reproduced with permission of Springer, Dordrecht, The Netherlands.
Fig. 8:
K. I. Popov, M. G. Pavlović, E. R. Stojilković, Z. Ž. Stevanović, „The current density distribution on stationary wire electrodes during copper and lead electrodeposition”, Hydrometallurgy, 46(1997)321-36, Fig. 8, p. 332. Reproduced with permission of Elsevier.
Konstantin I. Popov, Stojan S. Djokić, Branimir N. Grgur, „Fundamental Aspects of Electrometallurgy“, Kluwer Academic / Plenum Publishers, New York, 2002, Fig. 4.23, Chapter 4, p. 128. Reproduced with permission of Springer, Dordrecht, The Netherlands.
Fig. 9:
K. I. Popov, M. G. Pavlović, E. R. Stojilković, Z. Ž. Stevanović, „The current density distribution on stationary wire electrodes during copper and lead electrodeposition”, Hydrometallurgy, 46(1997)321-36, Fig. 9, p. 333. Reproduced with permission of Elsevier.
Konstantin I. Popov, Stojan S. Djokić, Branimir N. Grgur, „Fundamental Aspects of Electrometallurgy“, Kluwer Academic / Plenum Publishers, New York, 2002, Fig. 4.24, Chapter 4, p. 129. Reproduced with permission of Springer, Dordrecht, The Netherlands.
Fig. 10:
K. I. Popov, Z. P. Rodaljević, N. V. Krstajić, S. D. Novaković, „Fundamental aspects of plating technology V: The effect of strongly adsorbed species on the morphology of metal deposits“, Surf. Technol. 25(1985)217-22, Fig. 1, p. 218. Reproduced with permission of Elsevier.
Konstantin I. Popov, Stojan S. Djokić, Branimir N. Grgur, „Fundamental Aspects of Electrometallurgy“, Kluwer Academic / Plenum Publishers, New York, 2002, Fig. 4.25, Chapter 4, p. 130. Reproduced with permission of Springer, Dordrecht, The Netherlands.
Fig. 11:
K. I. Popov, Z. P. Rodaljević, N. V. Krstajić, S. D. Novaković, „Fundamental aspects of plating technology V: The effect of strongly adsorbed species on the morphology of metal deposits“, Surf. Technol. 25(1985)217-22, Fig. 3 c), d), p. 220. Reproduced with permission of Elsevier.
Konstantin I. Popov, Stojan S. Djokić, Branimir N. Grgur, „Fundamental Aspects of Electrometallurgy“, Kluwer Academic / Plenum Publishers, New York, 2002, Fig. 4.26, Chapter 4, p. 130. Reproduced with permission of Springer, Dordrecht, The Netherlands.
Fig. 12:
K. I. Popov, R. M. Stevanović, „A new current line division concept for the determination of the current distribution in electrochemical cells. Part I. Theoretical background of the corner weakness effect in electroforming“, J. Serb. Chem. Soc., 65(2000)905-914, Fig. 8, p. 912. Reproduced with permission of the The Serbian Chemical Society, Belgrade, Serbia.
Konstantin I. Popov, Stojan S. Djokić, Branimir N. Grgur, „Fundamental Aspects of Electrometallurgy“, Kluwer Academic / Plenum Publishers, New York, 2002, Fig. 4.30, Chapter 4, p. 133. Reproduced with permission of Springer, Dordrecht, The Netherlands.
Fig. 13:
K. I. Popov , R. M. Stevanović, „A new current line division concept for the determination of the current distribution in electrochemical cells. Part I. Theoretical background of the corner weakness effect in electroforming“, J. Serb. Chem. Soc., 65(2000)905-914, Fig. 7, p. 912. Reproduced with permission of the The Serbian Chemical Society, Belgrade, Serbia.
Konstantin I. Popov, Stojan S. Djokić, Branimir N. Grgur, „Fundamental Aspects of Electrometallurgy“, Kluwer Academic / Plenum Publishers, New York, 2002, Fig. 4.32, Chapter 4, p. 136. Reproduced with permission of Springer, Dordrecht, The Netherlands.
Fig. 14:
K. I. Popov, R. M. Stevanović, „A new current line division concept for the determination of the current distribution in electrochemical cells. Part I. Theoretical background of the corner weakness effect in electroforming“, J. Serb. Chem. Soc., 65(2000)905-914, Fig. 12, p. 914. Reproduced with permission of the The Serbian Chemical Society, Belgrade, Serbia.
Konstantin I. Popov, Stojan S. Djokić, Branimir N. Grgur, „Fundamental Aspects of Electrometallurgy“, Kluwer Academic / Plenum Publishers, New York, 2002, Fig. 4.38, Chapter 4, p. 141. Reproduced with permission of Springer, Dordrecht, The Netherlands.
Fig. 15:
K. I. Popov, R. M. Stevanović, P. M. Živković, „The effect of electrodeposition process parameters on the current density distribution in an electrochemical cell“, J. Serb. Chem. Soc., 66(2001)131-137, Fig. 1, p. 131. Reproduced with permission of The Serbian Chemical Society, Belgrade, Serbia.
Fig. 16:
K. I. Popov, R. M. Stevanović, P. M. Živković, „The effect of electrodeposition process parameters on the current density distribution in an electrochemical cell“, J. Serb. Chem. Soc., 66(2001)131-137, Fig. 3, p. 134. Reproduced with permission of The Serbian Chemical Society, Belgrade, Serbia.
Fig. 17:
K. I. Popov, R. M. Stevanović, P. M. Živković, „The effect of electrodeposition process parameters on the current density distribution in an electrochemical cell“, J. Serb. Chem. Soc., 66(2001)131-137, Fig. 6, p. 135. Reproduced with permission of The Serbian Chemical Society, Belgrade, Serbia.
Fig. 18:
K. I. Popov, R. M. Stevanović, P. M. Živković, „The effect of electrodeposition process parameters on the current density distribution in an electrochemical cell“, J. Serb. Chem. Soc., 66(2001)131-137, Fig. 7, p. 136. Reproduced with permission of The Serbian Chemical Society, Belgrade, Serbia.
Fig. 19:
K. I. Popov, R. M. Stevanović, „A new current line division concept for the determination of the current distribution in electrochemical cells. Part I. Theoretical background of the corner weakness effect in electroforming“, J. Serb. Chem. Soc., 65(2000)905-914, Fig. 2, p. 907. Reproduced with permission of The Serbian Chemical Society, Belgrade, Serbia.
Konstantin I. Popov, Stojan S. Djokić, Branimir. N. Grgur, „Fundamental Aspects of Electrometallurgy“, Kluwer Academic / Plenum Publishers, New York, 2002, Fig. 4.31, Chapter 4, p. 134. Reproduced with permission of Springer, Dordrecht, The Netherlands.
Fundamental Aspects of Electrometallurgy, K. I. Popov, S. S. Djokic, and B. N. Grgur, Chapter IV, Kluwer Academic/Plenum Publishers, New York, 2002.
Current Distribution, N. Ibl, in “Comprehensive Treatise of Electrochemistry” Volume 6, Chapter 4, pp 239-315, E. B. Yeager, J. O'M. Bockris, B. E. Conway and S. Sarangapani (editors), Plenum Press, New York, 1983.